Compare DE genes across methods
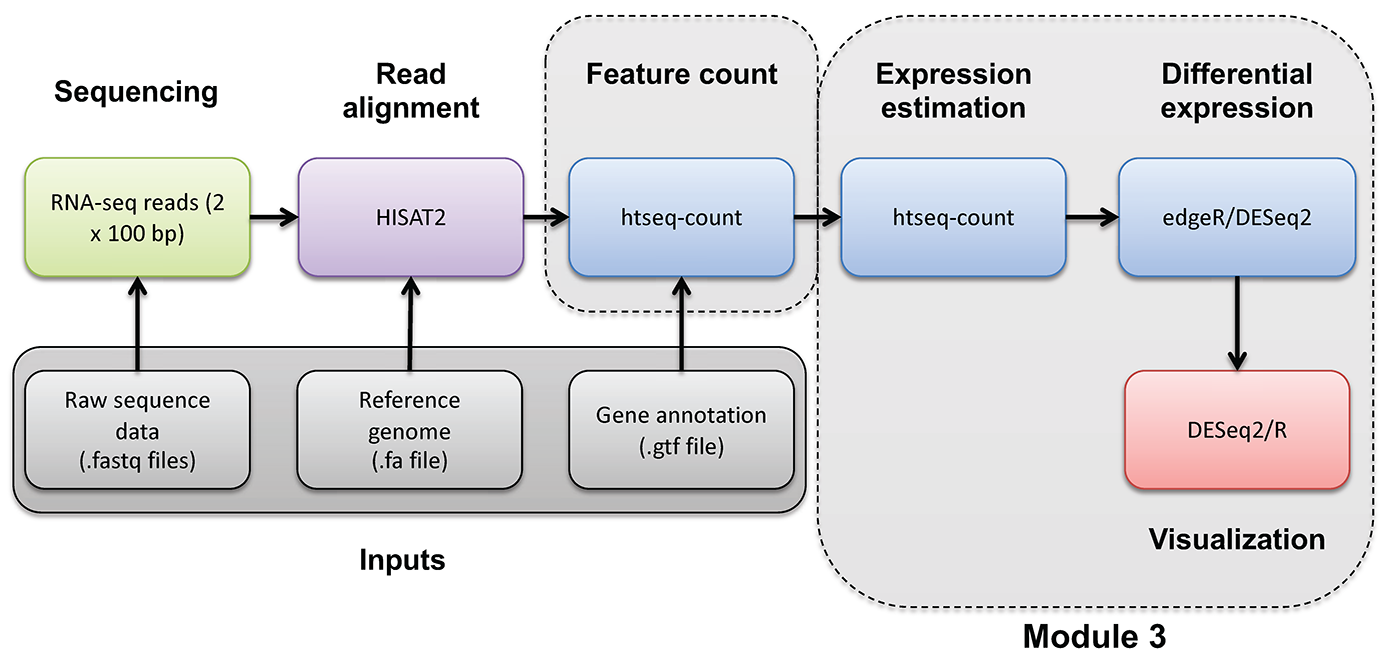
In this section we will compare the DE gene lists obtained from different DE methods (e.g. Ballgown, EdgeR, DESeq2)
Visualize overlap with a venn diagram. This can be done with simple web tools like:
Once you have run the DESeq2 tutorial, compare the sigDE genes to those saved earlier from ballgown and/or edgeR:
head $RNA_HOME/de/ballgown/ref_only/DE_sig_genes_ballgown.tsv
head $RNA_HOME/de/htseq_counts/edgeR/DE_sig_genes_edgeR.tsv
head $RNA_HOME/de/htseq_counts/deseq2/DE_sig_genes_DESeq2.tsv
Pull out the gene IDs
cd $RNA_HOME/de/

cut -f 1 $RNA_HOME/de/ballgown/ref_only/DE_sig_genes_ballgown.tsv | sort | uniq > ballgown_DE_gene_symbols.txt
cut -f 2 $RNA_HOME/de/htseq_counts/edgeR/DE_sig_genes_edgeR.tsv | sort | uniq | grep -v Gene_Name > htseq_counts_edgeR_DE_gene_symbols.txt
cut -f 7 $RNA_HOME/de/htseq_counts/deseq2/DE_sig_genes_DESeq2.tsv | sort | uniq | grep -v Symbol > htseq_counts_DESeq2_DE_gene_symbols.txt
To get the gene lists you could use cat to print out each list in your terminal and then copy/paste.
cat ballgown_DE_gene_symbols.txt
cat htseq_counts_edgeR_DE_gene_symbols.txt
cat htseq_counts_DESeq2_DE_gene_symbols.txt
Alternatively you could view the lists in a web browser as you have done with other files. These files should be here:
- https://YOUR_PUBLIC_IPv4_ADDRESS/rnaseq/de/ballgown_DE_gene_symbols.txt
- https://YOUR_PUBLIC_IPv4_ADDRESS/rnaseq/de/htseq_counts_edgeR_DE_gene_symbols.txt
- https://YOUR_PUBLIC_IPv4_ADDRESS/rnaseq/de/htseq_counts_DESeq2_DE_gene_symbols.txt
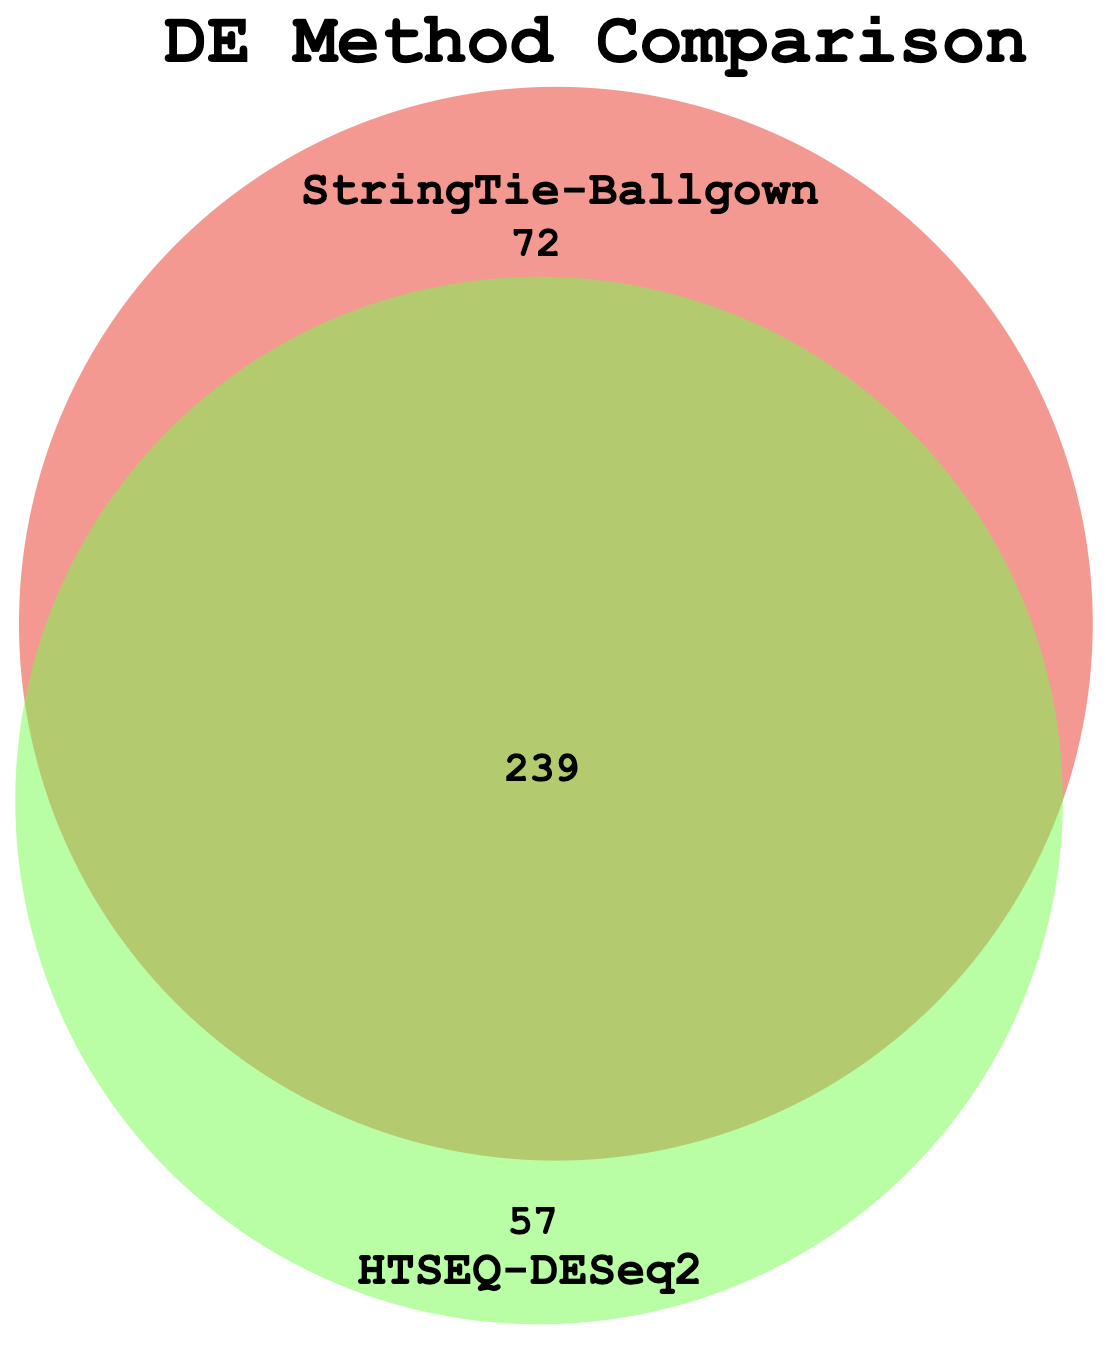
Example Venn Diagram (Two-way comparison: DE genes from StringTie/Ballgown vs HTSeq/DESeq2)
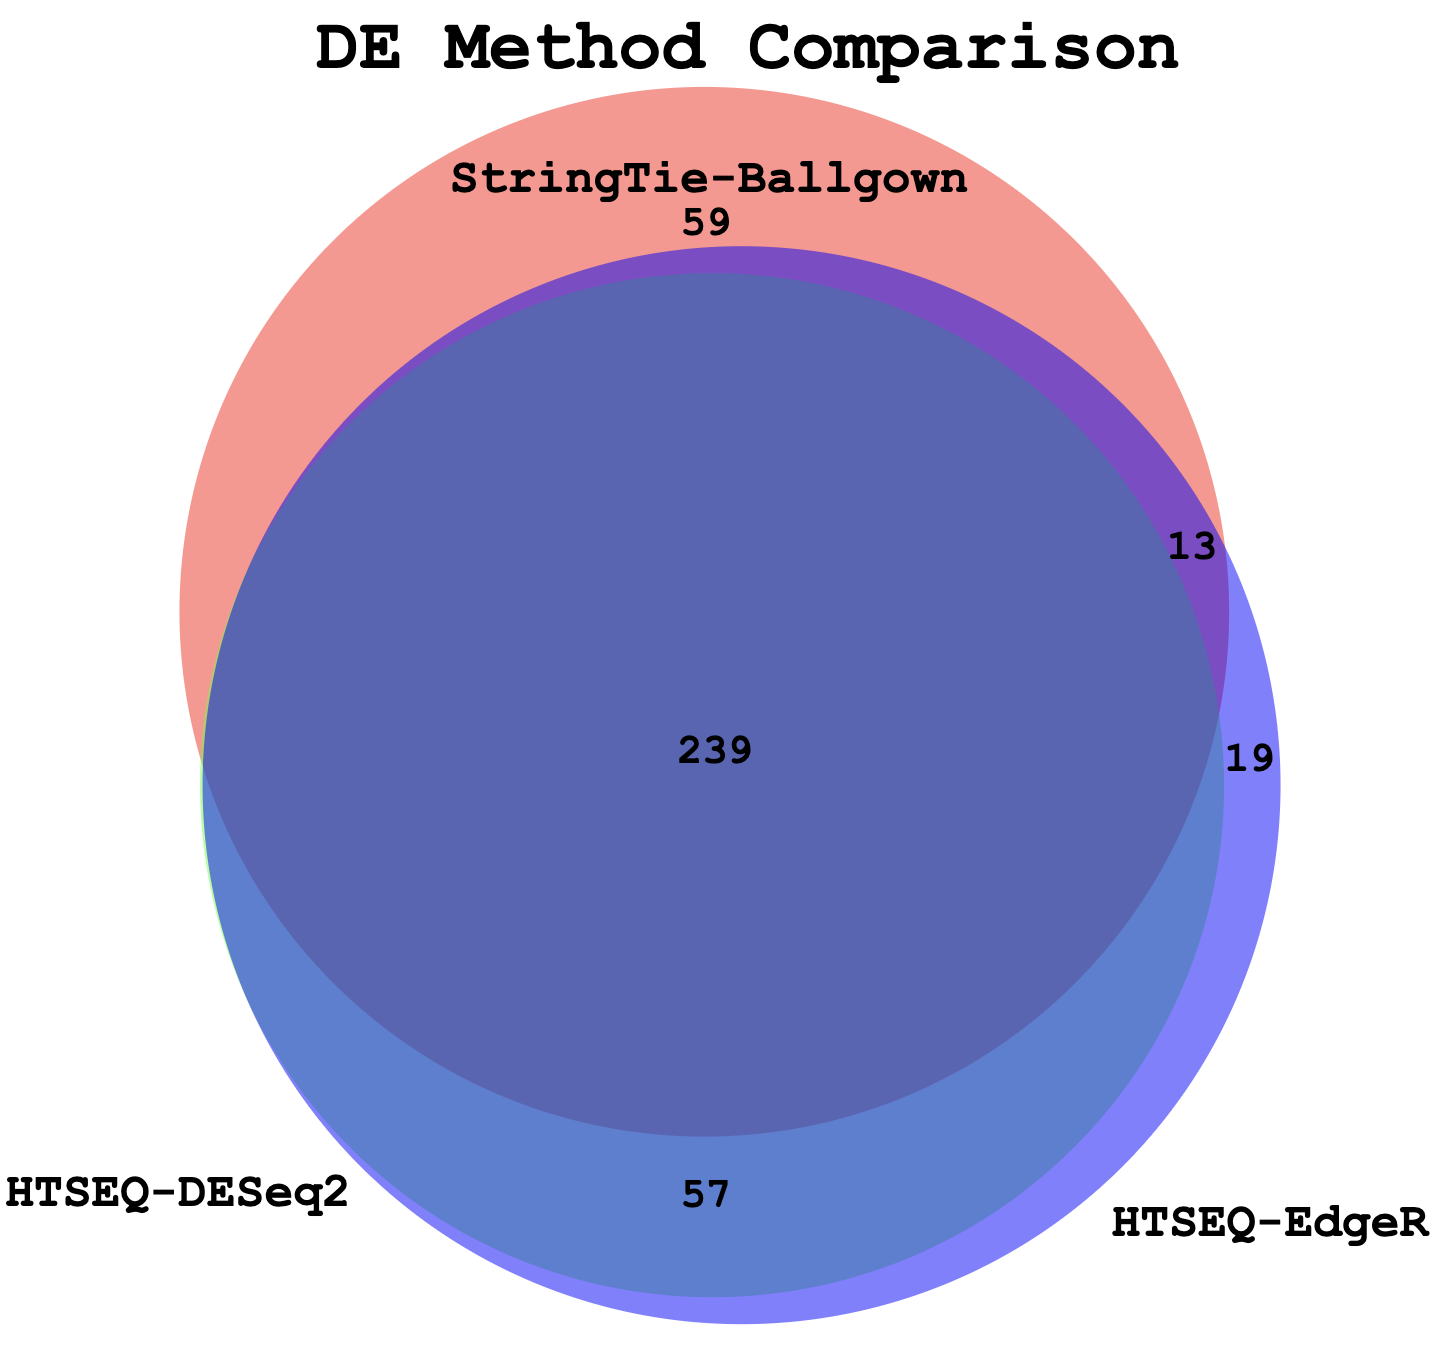
Example Venn Diagram (Three-way comparison: DE genes from StringTie/Ballgown vs HTSeq/DESeq2 vs HTSeq/EdgeR)
Compare the ERCC genes detected as significant by each DE method
Start an R session and produce a visualization that compares how many of the expected DE results for the ERCC spike in control data are detected by each method.
library(ggplot2)

setwd("~/workspace/rnaseq/de/ercc_spikein_analysis")

#load the ERCC expected fold change values for mix1 vs mix2
ercc_ref = read.table("ERCC_Controls_Analysis.txt", header=TRUE, sep="\t")[,c("ERCC.ID","expected.fold.change.ratio")]

#load the observed fold change values determined by our RNA-seq analysis
rna_de_fileBG = "~/workspace/rnaseq/de/ballgown/ref_only/UHR_vs_HBR_gene_results.tsv"
rna_de_fileDS = "~/workspace/rnaseq/de/htseq_counts/deseq2/DE_sig_genes_DESeq2.tsv"
rna_de_fileER = "~/workspace/rnaseq/de/htseq_counts/edgeR/DE_sig_genes_edgeR.tsv"

# Read files and rename relevant columns
rna_deBG = read.table(rna_de_fileBG, header=TRUE, sep="\t")[,c("id", "qval")]
colnames(rna_deBG) = c("ensemblID", "Ballgown")
rna_deDS = read.table(rna_de_fileDS, header=TRUE, sep="\t")[,c("ensemblID", "padj")]
colnames(rna_deDS) = c("ensemblID", "DESeq2")
rna_deER = read.table(rna_de_fileER, header=TRUE, sep="\t")[,c("Gene", "FDR")]
colnames(rna_deER) = c("ensemblID", "edgeR")

#merge and melt results from all DE algorithms
ercc_ref_de = merge(x = ercc_ref, y = rna_deBG, by.x = "ERCC.ID", by.y = "ensemblID", all.x = TRUE)
ercc_ref_de = merge(x = ercc_ref_de, y = rna_deDS, by.x = "ERCC.ID", by.y = "ensemblID", all.x = TRUE)
ercc_ref_de = merge(x = ercc_ref_de, y = rna_deER, by.x = "ERCC.ID", by.y = "ensemblID", all.x = TRUE)
ercc_ref_de_long = reshape2::melt(ercc_ref_de, id.vars = c("ERCC.ID","expected.fold.change.ratio"), variable.name = "algorithm")

# transform adjusted p-values into binnary
ercc_ref_de_long$value[ercc_ref_de_long$value > 0.05] = NA
ercc_ref_de_long$is_sig = !(is.na(ercc_ref_de_long$value))
# change to factor, or else ggplot will interpret these numbers as positions
ercc_ref_de_long$expected.fold.change.ratio = as.factor(ercc_ref_de_long$expected.fold.change.ratio)

#create a scatterplot to compare the observed and expected fold change values
p = ggplot(ercc_ref_de_long, aes(x = expected.fold.change.ratio, fill =is_sig))
p = p + geom_bar() + facet_grid(~algorithm)
p

ggsave(plot=p, filename = "ERCC_DE_Gene_Method_Comparison.pdf", device="pdf", width=6, height=4, units="in")

quit(save="no")