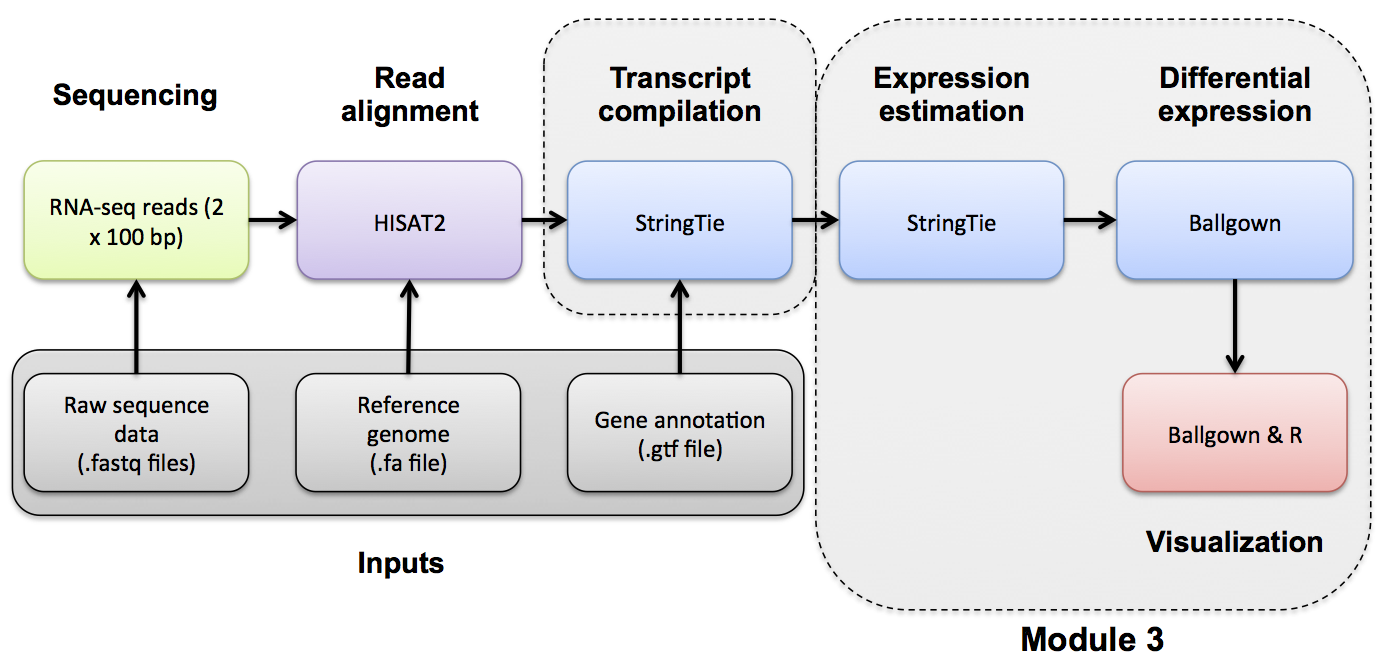
Differential Expression with Ballgown

Differential Expression mini lecture
If you would like a brief refresher on differential expression analysis, please refer to the mini lecture.
Ballgown DE Analysis
Use Ballgown to compare the UHR and HBR conditions. Refer to the Ballgown manual for a more detailed explanation:
Create and change to ballgown ref-only results directory:
mkdir -p $RNA_HOME/de/ballgown/ref_only/
cd $RNA_HOME/de/ballgown/ref_only/
Perform UHR vs. HBR comparison, using all replicates, for known (reference only mode) transcripts:
First, start an R session:
R
Run the following R commands in your R session.
# load the required libraries
library(ballgown)
library(genefilter)
library(dplyr)
library(devtools)

# Create phenotype data needed for ballgown analysis
ids=c("UHR_Rep1","UHR_Rep2","UHR_Rep3","HBR_Rep1","HBR_Rep2","HBR_Rep3")
type=c("UHR","UHR","UHR","HBR","HBR","HBR")
results="/home/ubuntu/workspace/rnaseq/expression/stringtie/ref_only/"
path=paste(results,ids,sep="")
pheno_data=data.frame(ids,type,path)

# Load ballgown data structure and save it to a variable "bg"
bg = ballgown(samples=as.vector(pheno_data$path), pData=pheno_data)

# Display a description of this object
bg

# Load all attributes including gene name
bg_table = texpr(bg, 'all')
bg_gene_names = unique(bg_table[,9:10])
bg_transcript_names = unique(bg_table[,c(1,6)])

# Save the ballgown object to a file for later use
save(bg, file='bg.rda')

# Perform differential expression (DE) analysis with no filtering, at both gene and transcript level
results_transcripts = stattest(bg, feature="transcript", covariate="type", getFC=TRUE, meas="FPKM")
results_transcripts = merge(results_transcripts, bg_transcript_names, by.x=c("id"), by.y=c("t_id"))

results_genes = stattest(bg, feature="gene", covariate="type", getFC=TRUE, meas="FPKM")
results_genes = merge(results_genes, bg_gene_names, by.x=c("id"), by.y=c("gene_id"))

# Save a tab delimited file for both the transcript and gene results
write.table(results_transcripts, "UHR_vs_HBR_transcript_results.tsv", sep="\t", quote=FALSE, row.names = FALSE)
write.table(results_genes, "UHR_vs_HBR_gene_results.tsv", sep="\t", quote=FALSE, row.names = FALSE)

# Filter low-abundance genes. Here we remove all transcripts with a variance across the samples of less than one
bg_filt = subset (bg,"rowVars(texpr(bg)) > 1", genomesubset=TRUE)

# Load all attributes including gene name
bg_filt_table = texpr(bg_filt , 'all')
bg_filt_gene_names = unique(bg_filt_table[, 9:10])
bg_filt_transcript_names = unique(bg_filt_table[,c(1,6)])

# Perform DE analysis now using the filtered data
results_transcripts = stattest(bg_filt, feature="transcript", covariate="type", getFC=TRUE, meas="FPKM")
results_transcripts = merge(results_transcripts, bg_filt_transcript_names, by.x=c("id"), by.y=c("t_id"))

results_genes = stattest(bg_filt, feature="gene", covariate="type", getFC=TRUE, meas="FPKM")
results_genes = merge(results_genes, bg_filt_gene_names, by.x=c("id"), by.y=c("gene_id"))

# Output the filtered list of genes and transcripts and save to tab delimited files
write.table(results_transcripts, "UHR_vs_HBR_transcript_results_filtered.tsv", sep="\t", quote=FALSE, row.names = FALSE)
write.table(results_genes, "UHR_vs_HBR_gene_results_filtered.tsv", sep="\t", quote=FALSE, row.names = FALSE)

# Identify the significant genes with p-value < 0.05
sig_transcripts = subset(results_transcripts, results_transcripts$pval<0.05)
sig_genes = subset(results_genes, results_genes$pval<0.05)

# Output the significant gene results to a pair of tab delimited files
write.table(sig_transcripts, "UHR_vs_HBR_transcript_results_sig.tsv", sep="\t", quote=FALSE, row.names = FALSE)
write.table(sig_genes, "UHR_vs_HBR_gene_results_sig.tsv", sep="\t", quote=FALSE, row.names = FALSE)

# Exit the R session
quit(save="no")
Once you have completed the Ballgown analysis in R, exit the R session and continue with the steps below. A copy of the above R code is located here.
What does the raw output from Ballgown look like?
head UHR_vs_HBR_gene_results.tsv
How many genes are there on this chromosome?
grep -v feature UHR_vs_HBR_gene_results.tsv | wc -l
How many passed filter in UHR or HBR?
grep -v feature UHR_vs_HBR_gene_results_filtered.tsv | wc -l
How many differentially expressed genes were found on this chromosome (p-value < 0.05)?
grep -v feature UHR_vs_HBR_gene_results_sig.tsv | wc -l
Display the top 20 DE genes. Look at some of those genes in IGV - do they make sense?
In the following commands we use grep -v feature to remove lines that contain “feature”. Then we use sort to sort the data in various ways. The k option specifies that we want to sort on a particular column (3 in this case which has the DE fold change values). The n option tells sort to sort numerically. The r option tells sort to reverse the sort.
grep -v feature UHR_vs_HBR_gene_results_sig.tsv | sort -rnk 3 | head -n 20 | column -t #Higher abundance in UHR
grep -v feature UHR_vs_HBR_gene_results_sig.tsv | sort -nk 3 | head -n 20 | column -t #Higher abundance in HBR
Save all genes with P<0.05 to a new file.
grep -v feature UHR_vs_HBR_gene_results_sig.tsv | cut -f 6 | sed 's/\"//g' > DE_genes.txt
head DE_genes.txt
PRACTICAL EXERCISE 9
Assignment: Use Ballgown to identify differentially expressed genes from the StringTie expression estimates (i.e., Ballgown table files) which you created in Practical Exercise 8.
- Hint: Follow the example R code above.
- Hint: You will need to change how the
pheno_dataobject is created to point to the correct sample ids, type, and path to StringTie results files. - Hint: Make sure to save your ballgown data object to file (e.g.,
bg.rda) for use in subsequent practical exercises. - Hint: You may wish to save both a complete list of genes with differential expression results as well as a subset which are filtered and pass a significance test
Solution: When you are ready you can check your approach against the Solutions
ERCC DE Analysis
This section will compare the observed versus expected differential expression estimates for the ERCC spike-in RNAs:
cd $RNA_HOME/de/ballgown/ref_only
wget https://raw.githubusercontent.com/griffithlab/rnabio.org/master/assets/scripts/Tutorial_ERCC_DE.R
chmod +x Tutorial_ERCC_DE.R
./Tutorial_ERCC_DE.R $RNA_HOME/expression/htseq_counts/ERCC_Controls_Analysis.txt $RNA_HOME/de/ballgown/ref_only/UHR_vs_HBR_gene_results.tsv
View the results here:
- http://YOUR_PUBLIC_IPv4_ADDRESS/rnaseq/de/ballgown/ref_only/Tutorial_ERCC_DE.pdf
