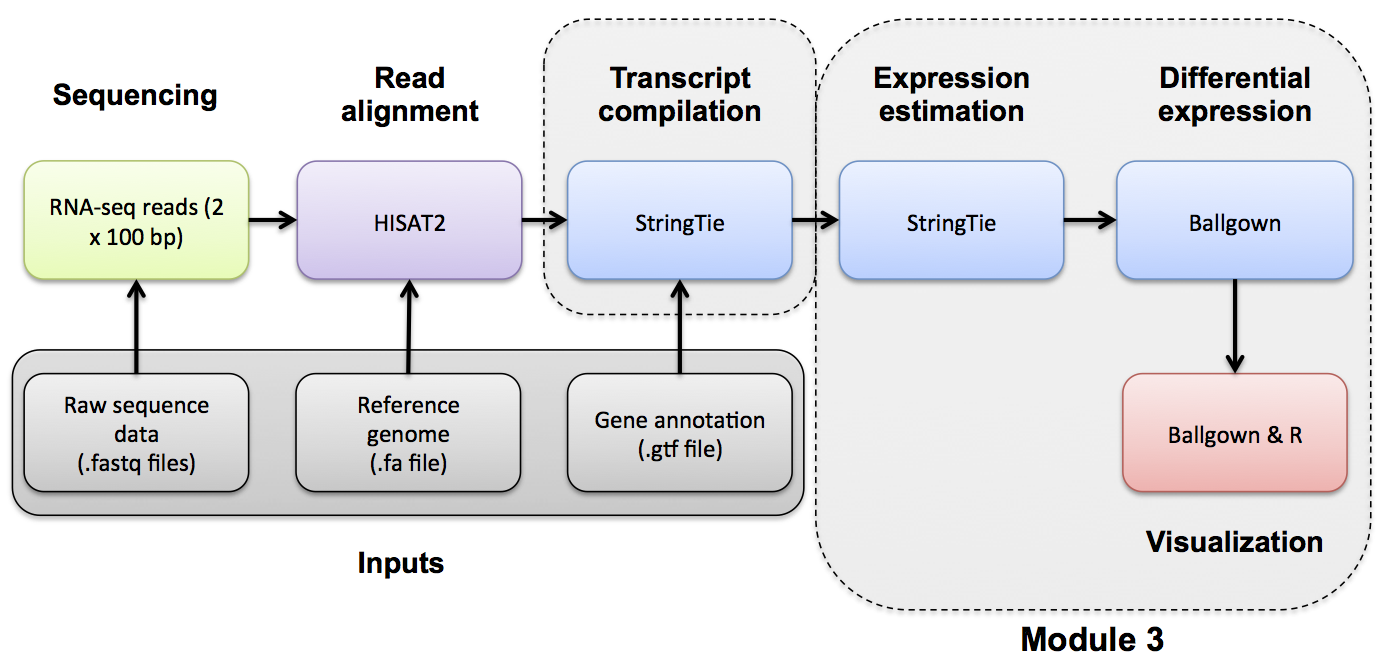
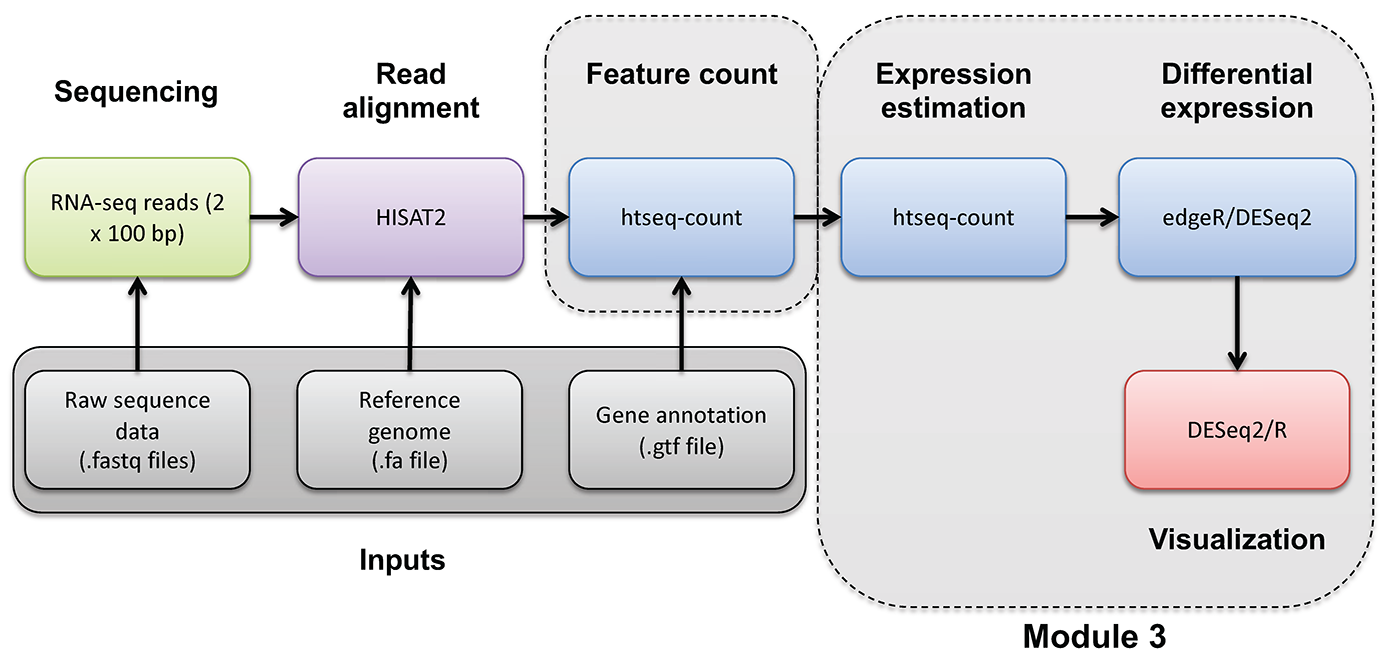
Expression Analysis with Stringtie and htseq-count
Expression mini lecture
If you would like a refresher on expression and abundance estimations, we have made a mini lecture.
Use Stringtie to generate expression estimates from the SAM/BAM files generated by HISAT2 in the previous module
Note on de novo transcript discovery and differential expression using Stringtie:
In this module, we will run Stringtie in ‘reference only’ mode. For simplicity and to reduce run time, it is sometimes useful to perform expression analysis with only known transcript models. However, Stringtie can predict the transcripts present in each library instead (by dropping the ‘-G’ option in stringtie commands as described in the next module). Stringtie will then assign arbitrary transcript IDs to each transcript assembled from the data and estimate expression for those transcripts. One complication with this method is that in each library a different set of transcripts is likely to be predicted for each library. There may be a lot of similarities but the number of transcripts and their exact structure will differ in the output files for each library. Before you can compare across libraries you therefore need to determine which transcripts correspond to each other across the libraries.
- Stringtie provides a merge command to combine predicted transcript GTF files from across different libraries
- Once you have a merged GTF file you can run Stringtie again with this instead of the known transcripts GTF file we used above
- Stringtie also provides ‘gffcompare’ to compare predicted transcripts to known transcripts
- Refer to the Stringtie manual for a more detailed explanation:
- https://ccb.jhu.edu/software/stringtie/index.shtml?t=manual
Stringtie basic usage:
stringtie <aligned_reads.bam> [options]*
Extra options specified below:
- ’–rf’ tells StringTie that our data is stranded and to use the correct strand specific mode (i.e. assume a stranded library fr-firststrand).
- ‘-p 4’ tells StringTie to use 4 CPUs
- ‘-G
' reference annotation to use for guiding the assembly process (GTF/GFF3) - ‘-e’ only estimate the abundance of given reference transcripts (requires -G)
- ‘-B’ enable output of Ballgown table files which will be created in the same directory as the output GTF (requires -G, -o recommended)
- ‘-o’ output path/file name for the assembled transcripts GTF (default: stdout)
- ‘-A’ output path/file name for gene abundance estimates
cd $RNA_HOME/
mkdir -p expression/stringtie/ref_only/
cd expression/stringtie/ref_only/

stringtie --rf -p 4 -G $RNA_REF_GTF -e -B -o HBR_Rep1/transcripts.gtf -A HBR_Rep1/gene_abundances.tsv $RNA_ALIGN_DIR/HBR_Rep1.bam
stringtie --rf -p 4 -G $RNA_REF_GTF -e -B -o HBR_Rep2/transcripts.gtf -A HBR_Rep2/gene_abundances.tsv $RNA_ALIGN_DIR/HBR_Rep2.bam
stringtie --rf -p 4 -G $RNA_REF_GTF -e -B -o HBR_Rep3/transcripts.gtf -A HBR_Rep3/gene_abundances.tsv $RNA_ALIGN_DIR/HBR_Rep3.bam

stringtie --rf -p 4 -G $RNA_REF_GTF -e -B -o UHR_Rep1/transcripts.gtf -A UHR_Rep1/gene_abundances.tsv $RNA_ALIGN_DIR/UHR_Rep1.bam
stringtie --rf -p 4 -G $RNA_REF_GTF -e -B -o UHR_Rep2/transcripts.gtf -A UHR_Rep2/gene_abundances.tsv $RNA_ALIGN_DIR/UHR_Rep2.bam
stringtie --rf -p 4 -G $RNA_REF_GTF -e -B -o UHR_Rep3/transcripts.gtf -A UHR_Rep3/gene_abundances.tsv $RNA_ALIGN_DIR/UHR_Rep3.bam
What does the raw output from Stringtie look like? For details on the Stringtie output files refer to Stringtie manual (outputs section)
less -S UHR_Rep1/transcripts.gtf
View transcript records only and improve formatting
grep -v "^#" UHR_Rep1/transcripts.gtf | grep -w "transcript" | column -t | less -S
Limit the view to transcript records and their expression values (FPKM and TPM values)
awk '{if ($3=="transcript") print}' UHR_Rep1/transcripts.gtf | cut -f 1,4,9 | less -S
Press ‘q’ to exit the ‘less’ display
Gene and transcript level expression values can also be viewed in these two files:
column -t UHR_Rep1/t_data.ctab | less -S

less -S -x20 UHR_Rep1/gene_abundances.tsv
Create a tidy expression matrix files for the StringTie results. This will be done at both the gene and transcript level and also will take into account the various expression measures produced: coverage, FPKM, and TPM.
cd $RNA_HOME/expression/stringtie/ref_only/
wget https://raw.githubusercontent.com/griffithlab/rnabio.org/master/assets/scripts/stringtie_expression_matrix.pl
chmod +x stringtie_expression_matrix.pl

./stringtie_expression_matrix.pl --expression_metric=TPM --result_dirs='HBR_Rep1,HBR_Rep2,HBR_Rep3,UHR_Rep1,UHR_Rep2,UHR_Rep3' --transcript_matrix_file=transcript_tpm_all_samples.tsv --gene_matrix_file=gene_tpm_all_samples.tsv

./stringtie_expression_matrix.pl --expression_metric=FPKM --result_dirs='HBR_Rep1,HBR_Rep2,HBR_Rep3,UHR_Rep1,UHR_Rep2,UHR_Rep3' --transcript_matrix_file=transcript_fpkm_all_samples.tsv --gene_matrix_file=gene_fpkm_all_samples.tsv

./stringtie_expression_matrix.pl --expression_metric=Coverage --result_dirs='HBR_Rep1,HBR_Rep2,HBR_Rep3,UHR_Rep1,UHR_Rep2,UHR_Rep3' --transcript_matrix_file=transcript_coverage_all_samples.tsv --gene_matrix_file=gene_coverage_all_samples.tsv

column -t transcript_tpm_all_samples.tsv | less -S
column -t gene_tpm_all_samples.tsv | less -S
Later we will use these files to perform various comparisons of expression estimation tools (e.g. stringtie, kallisto, raw counts) and metrics (e.g. FPKM vs TPM).
PRACTICAL EXERCISE 8
Assignment: Use StringTie to Calculate transcript-level expression estimates for the alignments (bam files) you created in Practical Exercise 6.
- Hint: You should have six commands for 3 replicates each of tumor and normal samples.
Solution: When you are ready you can check your approach against the Solutions
Mini-lecture
For more on the differences between abundance estimates like FPKM and count data with HTSeq-count, see this mini lecture.
HTSEQ-COUNT
Run htseq-count on alignments instead to produce raw counts instead of FPKM/TPM values for differential expression analysis
Refer to the HTSeq documentation for a more detailed explanation:
htseq-count basic usage:
htseq-count [options] <sam_file> <gff_file>
Extra options specified below:
- ’–format’ specify the input file format one of BAM or SAM. Since we have BAM format files, select ‘bam’ for this option.
- ’–order’ provide the expected sort order of the input file. Previously we generated position sorted BAM files so use ‘pos’.
- ’–mode’ determines how to deal with reads that overlap more than one feature. We believe the ‘intersection-strict’ mode is best.
- ’–stranded’ specifies whether data is stranded or not. The TruSeq strand-specific RNA libraries suggest the ‘reverse’ option for this parameter.
- ’–minaqual’ will skip all reads with alignment quality lower than the given minimum value
- ’–type’ specifies the feature type (3rd column in GFF file) to be used. (default, suitable for RNA-Seq and Ensembl GTF files: exon)
- ’–idattr’ The feature ID used to identify the counts in the output table. The default, suitable for RNA-SEq and Ensembl GTF files, is gene_id.
Run htseq-count and calculate gene-level counts:
cd $RNA_HOME/
mkdir -p expression/htseq_counts
cd expression/htseq_counts

htseq-count --format bam --order pos --mode intersection-strict --stranded reverse --minaqual 1 --type exon --idattr gene_id $RNA_ALIGN_DIR/UHR_Rep1.bam $RNA_REF_GTF > UHR_Rep1_gene.tsv
htseq-count --format bam --order pos --mode intersection-strict --stranded reverse --minaqual 1 --type exon --idattr gene_id $RNA_ALIGN_DIR/UHR_Rep2.bam $RNA_REF_GTF > UHR_Rep2_gene.tsv
htseq-count --format bam --order pos --mode intersection-strict --stranded reverse --minaqual 1 --type exon --idattr gene_id $RNA_ALIGN_DIR/UHR_Rep3.bam $RNA_REF_GTF > UHR_Rep3_gene.tsv

htseq-count --format bam --order pos --mode intersection-strict --stranded reverse --minaqual 1 --type exon --idattr gene_id $RNA_ALIGN_DIR/HBR_Rep1.bam $RNA_REF_GTF > HBR_Rep1_gene.tsv
htseq-count --format bam --order pos --mode intersection-strict --stranded reverse --minaqual 1 --type exon --idattr gene_id $RNA_ALIGN_DIR/HBR_Rep2.bam $RNA_REF_GTF > HBR_Rep2_gene.tsv
htseq-count --format bam --order pos --mode intersection-strict --stranded reverse --minaqual 1 --type exon --idattr gene_id $RNA_ALIGN_DIR/HBR_Rep3.bam $RNA_REF_GTF > HBR_Rep3_gene.tsv
Merge results files into a single matrix for use in edgeR. The following joins the results for each replicate together, adds a header, reformats the result as a tab delimited file, and shows you the first 10 lines of the resulting file :
cd $RNA_HOME/expression/htseq_counts/
join UHR_Rep1_gene.tsv UHR_Rep2_gene.tsv | join - UHR_Rep3_gene.tsv | join - HBR_Rep1_gene.tsv | join - HBR_Rep2_gene.tsv | join - HBR_Rep3_gene.tsv > gene_read_counts_table_all.tsv
echo "GeneID UHR_Rep1 UHR_Rep2 UHR_Rep3 HBR_Rep1 HBR_Rep2 HBR_Rep3" > header.txt
cat header.txt gene_read_counts_table_all.tsv | grep -v "__" | awk -v OFS="\t" '$1=$1' > gene_read_counts_table_all_final.tsv
rm -f gene_read_counts_table_all.tsv header.txt
head gene_read_counts_table_all_final.tsv | column -t
-grep -v "__" is being used to filter out the summary lines at the end of the files that ht-seq count gives to summarize reads that had no feature, were ambiguous, did not align at all, did not align due to poor alignment quality, or the alignment was not unique.
-awk -v OFS="\t" '$1=$1' is using awk to replace the single space characters that were in the concatenated version of our header.txt and gene_read_counts_table_all.tsv with a tab character. -v is used to reset the variable OFS, which stands for Output Field Separator. By default, this is a single space. By specifying OFS="\t", we are telling awk to replace the single space with a tab. The '$1=$1' tells awk to reevaluate the input using the new output variable.
Prepare for DE analysis using htseq-count results
Create a directory for the DEseq analysis based on the htseq-count results:
cd $RNA_HOME/
mkdir -p de/htseq_counts
cd de/htseq_counts
Note that the htseq-count results provide counts for each gene but uses only the Ensembl Gene ID (e.g. ENSG00000054611). This is not very convenient for biological interpretation. This next step creates a mapping file that will help us translate from ENSG IDs to Symbols. It does this by parsing the GTF transcriptome file we got from Ensembl. That file contains both gene names and IDs. Unfortunately, this file is a bit complex to parse. Furthermore, it contains the ERCC transcripts, and these have their own naming convention which also complicates the parsing.
# cut the 9th column of the GTF with all the gene annotation information
# use "tr -d" to delete all the double quotes from this string
# use AWK to search for the pattern "gene_id" or "gene_name" followed by space character and then any characters that are not ";": ([^;]+)
# the captured characters are the actual gene ID or Name. Store these in variables $gid and $gname and then print them out
# use sort and unique commands to produce a unique list of gene_name, gene_id combinations

cut -f 9 $RNA_REF_GTF | tr -d '"' | \
awk '{
      match($0, /gene_id[ ]+([^;]+)/, gid)
      match($0, /gene_name[ ]+([^;]+)/, gname)
      if (gid[1] && gname[1]) print gid[1], gname[1]
}' OFS='\t' | sort | uniq > ENSG_ID2Name.txt

head ENSG_ID2Name.txt
Determine the number of unique Ensembl Gene IDs and symbols. What does this tell you?
#count unique gene ids
cut -f 1 ENSG_ID2Name.txt | sort | uniq | wc -l

#count unique gene names
cut -f 2 ENSG_ID2Name.txt | sort | uniq | wc -l

#show the most repeated gene names
cut -f 2 ENSG_ID2Name.txt | sort | uniq -c | sort -r | head
Explore a few examples of cases where there are multiple distinct Ensembl Genes with the same symbol by referring back to the complete GTF. Long story short, these distinct gene loci with the same gene symbol correspond to atypical gene classes.
#DUXAP8. An example where both genes are different kinds of pseudogenes.
#Note the gene_biotype values: processed_transcript, transcribed_processed_pseudogene
#Note the coordinates (one is contained within the other)
grep -w gene $RNA_REF_GTF | grep DUXAP8

#SCARNA17. An example of an unusual gene class.
#Note the gene_biotype value: scaRNA (A class of non-coding RNA, "Small Cajal body-specific RNA").
#Note the coordinates (all distinct locations)
grep -w gene $RNA_REF_GTF | grep SCARNA17

#ELFN2
#Note the gene_biotype values: protein_coding, sense_overlapping
#sense_overlapping: "Long non-coding transcript that contains a coding gene in its intron on the same strand"
#Note the coordinates
grep -w gene $RNA_REF_GTF | grep ELFN2

#Y_RNA
#Note the gene_biotype value: misc_RNA
#Y RNAs are small non-coding RNAs. They are components of the Ro60 ribonucleoprotein particle
grep -w gene $RNA_REF_GTF | grep Y_RNA
ERCC expression analysis
Based on the above read counts, plot the linearity of the ERCC spike-in read counts observed in our RNA-seq data versus the expected concentration of the ERCC spike-in Mix.
First download a file describing the expected concentrations and fold-change differences for the ERCC spike-in reagent.
mkdir $RNA_HOME/expression/ercc_spikein_analysis/
cd $RNA_HOME/expression/ercc_spikein_analysis/
wget http://genomedata.org/rnaseq-tutorial/ERCC_Controls_Analysis.txt
cat ERCC_Controls_Analysis.txt
We will then merge our experimental RNA-seq read counts, determined for the ERCC transcripts, onto the table of expected concentrations. Finally, we will produce an x-y scatter plot that compares the expected and observed values.
First, start an R session:
R
Now combine the ERCC expected concentration data with the observed RNA-seq expression values and produce x-y scatter plots that compare the expected and observed values for HTSEQ raw counts and StringTie TPM abundance estimates.
library("ggplot2")
library("data.table")

#load in the reference/expected concentration and fold change values for each ERCC transcript
ercc_ref = read.table("ERCC_Controls_Analysis.txt", header=TRUE, sep="\t")
names(ercc_ref) = c("id", "ercc_id", "subgroup", "ref_conc_mix_1", "ref_conc_mix_2", "ref_fc_mix1_vs_mix2", "ref_log2_mix1_vs_mix2")
head(ercc_ref)
dim(ercc_ref)

#load the RNA-seq raw counts values for all samples and combined with the expected ERCC values
rna_counts_file = "~/workspace/rnaseq/expression/htseq_counts/gene_read_counts_table_all_final.tsv";
rna_counts = read.table(rna_counts_file, header=TRUE, sep="\t")
dim(rna_counts)

#combine the ERCC expected concentration information with the observed RNA-seq counts
ercc_ref_counts = merge(x = ercc_ref, y = rna_counts, by.x = "ercc_id", by.y = "GeneID", all.x = TRUE)

#convert UHR data to "long" format
uhr_data = ercc_ref_counts[,c("ercc_id","subgroup","ref_conc_mix_1","UHR_Rep1","UHR_Rep2","UHR_Rep3")]
uhr_data_long = melt(setDT(uhr_data), id.vars = c("ercc_id","subgroup","ref_conc_mix_1"), variable.name = "sample")
uhr_data_long$mix = "mix 1"
names(uhr_data_long) = c("ercc_id", "subgroup", "concentration", "sample", "count", "mix")

#convert HBR data to "long" format
hbr_data = ercc_ref_counts[,c("ercc_id","subgroup","ref_conc_mix_2","HBR_Rep1","HBR_Rep2","HBR_Rep3")]
hbr_data_long = melt(setDT(hbr_data), id.vars = c("ercc_id","subgroup","ref_conc_mix_2"), variable.name = "sample")
hbr_data_long$mix = "mix 2"
names(hbr_data_long) = c("ercc_id", "subgroup", "concentration", "sample", "count", "mix")

#rejoin the UHR and HBR tpm data
ercc_ref_counts_long <- rbind(uhr_data_long, hbr_data_long)
head(ercc_ref_counts_long)
dim(ercc_ref_counts_long)

#fit a linear model and calculate correlation between expected concentations and observed TPM values

min_nonzero_count = min(ercc_ref_counts_long$count[ercc_ref_counts_long$count > 0])
ercc_ref_counts_long$log_count = log2(ercc_ref_counts_long$count + min_nonzero_count)

min_nonzero_conc = min(ercc_ref_counts_long$concentration[ercc_ref_counts_long$concentration > 0])
ercc_ref_counts_long$log_concentration= log2(ercc_ref_counts_long$concentration + min_nonzero_conc)

count_model <- lm(log_count ~ log_concentration, data=ercc_ref_counts_long)
count_r_squared = summary(count_model)[["r.squared"]]
count_slope = coef(count_model)["log_concentration"]

p1 = ggplot(ercc_ref_counts_long, aes(x=log_concentration, y=log_count))
p1 = p1 + geom_point(aes(shape=mix, color=sample))
p1 = p1 + geom_smooth(method=lm)
p1 = p1 + annotate("text", 10, 5, label=paste("R^2 =", round(count_r_squared, digits=2), sep=" "))
p1 = p1 + annotate("text", 10, 4, label=paste("Slope =", round(count_slope, digits=2), sep=" "))
p1 = p1 + xlab("Log2 (expected concentration [amol/uL] + min non-zero value)") + ylab("Log2 (observed count + min non-zero value)")

pdf("ERCC_Count_Expression_vs_SpikeInConcentration.pdf")
print(p1)
dev.off()

#load the RNA-seq TPM values for all samples and combine with expected ERCC values
rna_tpms_file = "~/workspace/rnaseq/expression/stringtie/ref_only/gene_tpm_all_samples.tsv"
rna_tpms = read.table(rna_tpms_file, header=TRUE, sep="\t")
dim(rna_tpms)

#combine the ERCC expected concentration information with the observed RNA-seq TPM values
ercc_ref_tpms = merge(x = ercc_ref, y = rna_tpms, by.x = "ercc_id", by.y = "Gene_ID", all.x = TRUE)
dim(ercc_ref_tpms)

#convert UHR data to "long" format
uhr_data = ercc_ref_tpms[,c("ercc_id","subgroup","ref_conc_mix_1","UHR_Rep1","UHR_Rep2","UHR_Rep3")]
uhr_data_long = melt(setDT(uhr_data), id.vars = c("ercc_id","subgroup","ref_conc_mix_1"), variable.name = "sample")
uhr_data_long$mix = "mix 1"
names(uhr_data_long) = c("ercc_id", "subgroup", "concentration", "sample", "tpm", "mix")

#convert HBR data to "long" format
hbr_data = ercc_ref_tpms[,c("ercc_id","subgroup","ref_conc_mix_2","HBR_Rep1","HBR_Rep2","HBR_Rep3")]
hbr_data_long = melt(setDT(hbr_data), id.vars = c("ercc_id","subgroup","ref_conc_mix_2"), variable.name = "sample")
hbr_data_long$mix = "mix 2"
names(hbr_data_long) = c("ercc_id", "subgroup", "concentration", "sample", "tpm", "mix")

#rejoin the UHR and HBR tpm data
ercc_ref_tpms_long <- rbind(uhr_data_long, hbr_data_long)
head(ercc_ref_tpms_long)
dim(ercc_ref_tpms_long)

#fit a linear model and calculate correlation between expected concentations and observed TPM values
min_nonzero_tpm = min(ercc_ref_tpms_long$tpm[ercc_ref_tpms_long$tpm > 0])
ercc_ref_tpms_long$log_tpm = log2(ercc_ref_tpms_long$tpm + min_nonzero_tpm)

min_nonzero_conc = min(ercc_ref_tpms_long$concentration[ercc_ref_tpms_long$concentration > 0])
ercc_ref_tpms_long$log_concentration= log2(ercc_ref_tpms_long$concentration + min_nonzero_conc)

tpm_model <- lm(log_tpm ~ log_concentration, data=ercc_ref_tpms_long)
tpm_r_squared = summary(tpm_model)[["r.squared"]]
tpm_slope = coef(tpm_model)["log_concentration"]

p2 = ggplot(ercc_ref_tpms_long, aes(x=log_concentration, y=log_tpm))
p2 = p2 + geom_point(aes(shape=mix, color=sample))
p2 = p2 + geom_smooth(method=lm)
p2 = p2 + annotate("text", 10, 5, label=paste("R^2 =", round(tpm_r_squared, digits=2), sep=" "))
p2 = p2 + annotate("text", 10, 4, label=paste("Slope =", round(tpm_slope, digits=2), sep=" "))
p2 = p2 + xlab("Log2 (expected concentration [amol/uL] + min non-zero value)") + ylab("Log2 (observed TPM estimate + min non-zero value)")

pdf("ERCC_TPM_Expression_vs_SpikeInConcentration.pdf")
print(p2)
dev.off()

# Exit the R session
quit(save="no")
To view the resulting figures, navigate to the below URL replacing YOUR_IP_ADDRESS with your amazon instance IP address: $RNA_HOME/ercc_spikein_analysis/
- http://YOUR_PUBLIC_IPv4_ADDRESS/rnaseq/expression/ercc_spikein_analysis/ERCC_Count_Expression_vs_SpikeInConcentration.pdf
- http://YOUR_PUBLIC_IPv4_ADDRESS/rnaseq/expression/ercc_spikein_analysis/ERCC_TPM_Expression_vs_SpikeInConcentration.pdf
Which expression estimation (read counts or TPM values) are better representing the known/expected ERCC concentrations? Why?
Some notes of interpretation
- In general the expression estimates for ERCC transcripts we are getting from our data are highly correlated with the expected concentrations for the ERCC spike-in reagent
- There are some ERRC transcripts that were not detected in our data at all (count and TPM of 0). These correspond to a range of expected concentrations in the spile-in reagent but they are all at the lower end. Essentially this indicates a sensitivity limitation. With our downsampled RNAseq data, we are failing to detect some of the less abundant spiked-in ERCC transcripts. This is probably hurting our R squared values slightly.
- We observed a wide range of observed expression values for ERCC transcripts in both mixes. Remember that both mixes have ERCCs at low, medium, high levels (spread over 5-6 orders of magnitude). But between the two mixes the ERCCs at each expected concentration are different.
- Details on the ERCC spike-in reagent